Why your restaurant P&L needs separate labor lines for kitchen and dining room
A combined payroll line shows labor is over target. It shows nothing about which segment is responsible, and that is usually where the wrong fix comes from.
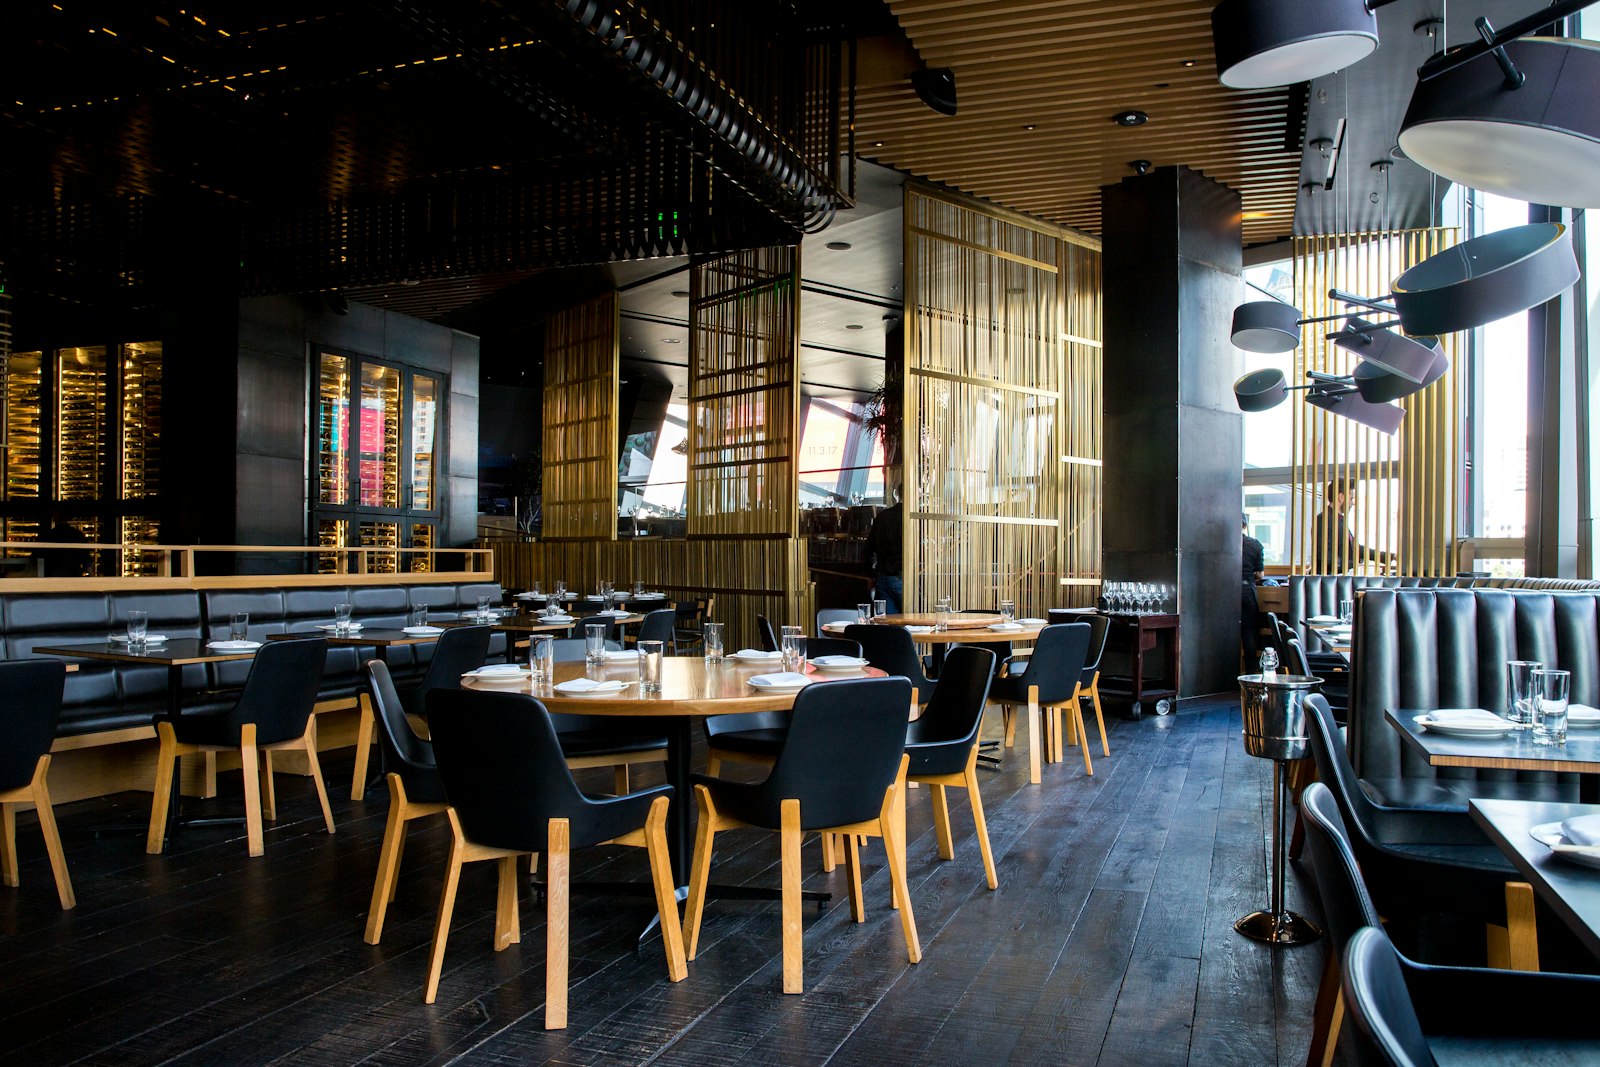
A restaurant owner we work with reviewed the weekly numbers and found labor running 4 points over target. She cut server hours for the following week. The dining room was understaffed, table turn times increased, and her general manager flagged three service complaints. The kitchen ran the same crew it had all month. At month-end, labor was still 3.5 points over target.
The problem was in the kitchen. The data she had only showed total labor.
Why a combined labor line falls short
Front-of-house and back-of-house labor respond to different inputs and carry different benchmarks. Servers and hosts scale more closely with covers. When Tuesday is slow, front-of-house labor can be reduced. Back-of-house labor is stickier. The kitchen needs a minimum crew on any service day, regardless of how many tables are occupied.
Front-of-house and back-of-house labor are driven by different factors. A month where FOH is over target calls for reviewing server-to-table ratios and whether slow periods are properly staffed down. A month where BOH is over target calls for reviewing prep schedules, day-part coverage, and whether a one-time event like a catering job carried staffing into the regular service week. Those are different conversations with different department leads.
QuickBooks posts all payroll to one account unless the setup says otherwise. When payroll is processed, the default configuration sends all hourly wages to a single payroll expense line. Kitchen wages, server wages, bartender wages, and dishwasher wages accumulate in the same balance. The Profit and Loss report (P&L) shows a growing number, but there is no embedded breakdown. Running the P&L does not answer the question of which segment is over.
An incorrect response to a combined total carries a real cost. Cutting server hours when BOH is the problem reduces the dining room’s capacity to seat and turn tables. The revenue impact of slower service can offset any labor savings from the cut. The period following a misdiagnosed adjustment is often worse than the one that preceded it.
What one month looked like with and without the breakdown
Here is the same payroll month shown two ways. Revenue for the period was $85,000. The combined labor target was 32 percent, or $27,200.
| Labor segment | Monthly wages | Percent of revenue | Target |
|---|---|---|---|
| Servers | $7,200 | 8.5% | 8.5% |
| Hosts and bussers | $2,800 | 3.3% | 3.5% |
| Bartenders | $1,400 | 1.6% | 1.7% |
| Kitchen and prep | $14,500 | 17.1% | 13.5% |
| Dishwashers | $4,700 | 5.5% | 4.8% |
| Total labor | $30,600 | 36.0% | 32.0% |
Front-of-house labor, combining servers, hosts, and bartenders, came to $11,400, or 13.4 percent of revenue. The FOH target was 13.7 percent. Front of house was $245 under budget.
Back-of-house labor, combining kitchen, prep, and dishwashers, came to $19,200, or 22.6 percent. The BOH target was 18.3 percent. A catering prep schedule that ran into the regular service week added approximately $1,800 in kitchen labor that was not reflected in the standard schedule, and the dishwasher crew was extended an extra two shifts for post-event cleanup.
The $3,400 total overage was entirely in BOH. Front of house was on target and available for full service.
Why this matters for operations
The scheduling decision depends on knowing which segment is over. BOH over budget points toward kitchen scheduling, prep coverage, and how catering labor is being absorbed into the weekly crew. FOH over budget points toward server ratios, host coverage, and whether a slow period was properly staffed down. Without the segmented P&L, the response is a guess.
Benchmarks differ by segment, and managing against the total alone masks drift in either one. A restaurant targeting 32 percent combined labor can hit that number while running FOH at 16 percent and BOH at 16 percent, or FOH at 12 percent and BOH at 20 percent. Those are different operational profiles with different implications. When one segment drifts and the other compensates, the total looks fine until both drift in the same direction.
The cost of a misdiagnosed labor problem compounds. Cutting service capacity in a period where the kitchen is over budget reduces the restaurant’s ability to generate the revenue that makes the labor percentage manageable. A month with lower revenue and the same BOH crew produces an even higher BOH percentage.
What a split labor setup looks like in practice
For restaurant clients we work with, the setup uses class tracking in QuickBooks. A class is assigned to each labor segment: Front of House, Back of House, and Management. Every payroll run distributes wages to the applicable class based on each employee’s assigned role.
The P&L by class report shows a separate labor subtotal for each segment, alongside the combined total. The general manager reviews it before the following week’s schedule is posted.
Setup typically takes about two hours: configure the classes in QuickBooks, assign each employee to a class in the payroll module, and save a P&L by class filter that runs automatically each week. Once configured, the report updates every payroll cycle without additional steps.
Most managers who run the class P&L for the first time identify at least one segment that has been drifting off its individual target for more than one pay period, even in months where the total looked acceptable.
Best practices for restaurant labor cost tracking
- Start with three classes: Front of House, Back of House, and Management. Add further detail within those segments only after the team is pulling the basic report consistently.
- Set a target percentage for each class separately, not just for the combined total. The individual targets do not have to add up to a round number.
- Run the class P&L weekly before the schedule is built, not monthly after the period closes. Labor management is a forward-looking function, and monthly data arrives too late to affect the following week.
- Include owner and manager wages in a separate Management class. Management labor mixed into FOH or BOH distorts both segments’ cost percentage.
- When a segment runs over its target two periods in a row, trace it to the day-part level. A segment overage usually traces to one shift, one role, or one recurring event that was not scheduled down.
Three questions worth asking
- When total labor ran over target last month, do you know which segment was responsible, and how did you find out?
- Does your current QuickBooks setup show separate payroll lines for kitchen wages and server wages, or one combined payroll total?
- What is your back-of-house labor cost as a percentage of revenue this month, and how does it compare to the prior month?
If those answers are uncertain, the books are reporting a total labor number without the segment detail that scheduling decisions depend on. Setting up class tracking takes one afternoon and produces a more useful weekly report starting the following pay cycle.
If you want a second set of eyes on your current setup, send us your most recent payroll summary and your QuickBooks chart of accounts. We will show you whether the books are supporting the right scheduling conversation.
- TOTAL WAGES$30,600 in one payroll expense line, no segment detail
- LABOR PERCENTAGE36 percent of revenue, 4 points over the 32 percent target
- VISIBLE CAUSENone. Total labor is over. Source unknown.
- MANAGEMENT RESPONSEServer hours cut first, kitchen crew unchanged
- FOH LABOR$11,400 for servers, hosts, and bartenders, 13.4 percent
- BOH LABOR$19,200 for kitchen, prep, and dish, 22.6 percent
- VISIBLE CAUSEBOH over by $3,400. FOH at target. One segment, not two.
- MANAGEMENT RESPONSEKitchen scheduling reduced, dining room service maintained
Want a second set of eyes on your books?
30 minutes on Zoom. We'll look at your books and tell you what's working and what isn't.
This is the work we do every day. See bookkeeping for restaurants.
Book a call