When your catering and dining room share one P&L, neither number is right
Most restaurants blend catering and dining room revenue into one report. When you separate them, the margin gap between the two operations is usually dramatic.
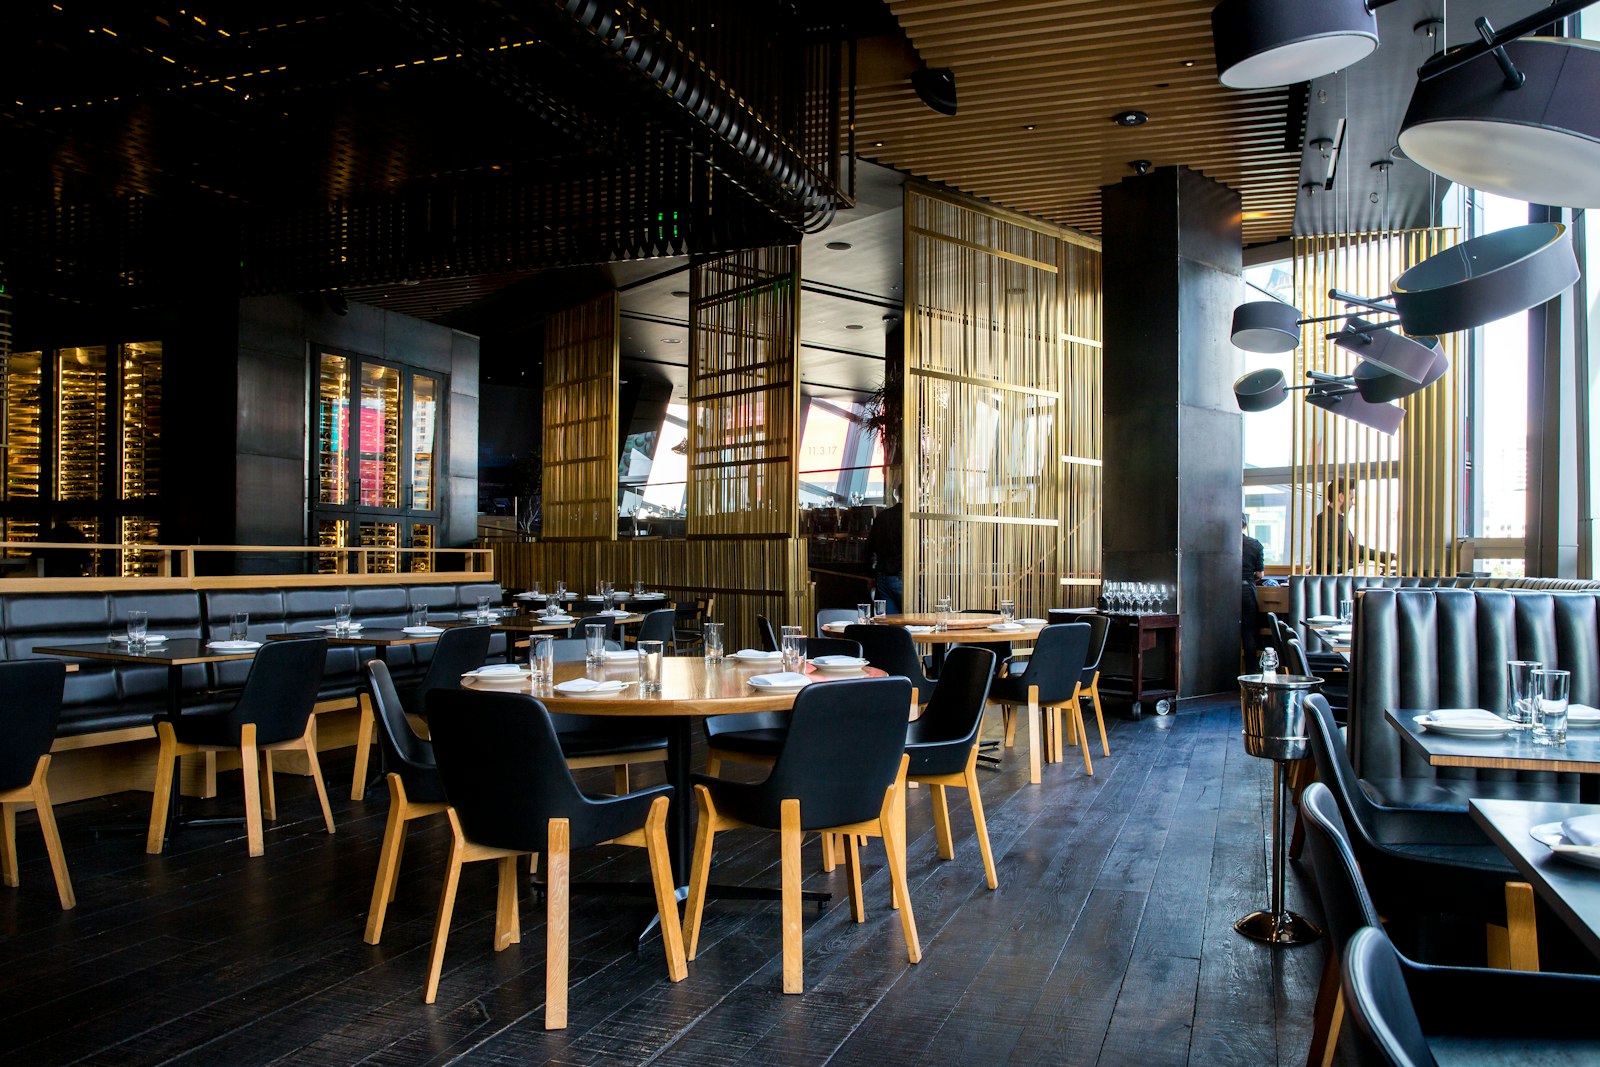
A restaurant we work with runs a dining room Thursday through Saturday and a catering operation that handles corporate lunches and private events the rest of the week. Both channels share the same kitchen, the same walk-in cooler, and some of the same staff.
On the Profit and Loss report (P&L) for March, food cost showed 30 percent and labor showed 38 percent. Net margin was 12 percent. The owner considered the month acceptable.
In April, a corporate client moved their standing weekly lunch order to another vendor. Revenue dropped by $14,000. Net income went from positive to negative $3,200. The owner could not explain why a single catering client had that much impact on the books.
The books could not explain it either. The books had never separated the two operations.
Two operations, one blended report
A restaurant dining room and a catering operation run on different cost structures. Combining their revenue and costs into a single P&L averages together numbers that should never be averaged.
Catering menus are simplified and portioned in advance. Food cost for catering tends to run lower because there is less waste, fewer substitutions, and no open-menu variability. Dining room food cost is higher because of prep waste, menu mix shifts, and the one-off plates that happen during every service. When those costs blend into a single percentage, neither channel’s actual food cost is visible.
The same logic applies to labor. Catering labor is largely direct: staff are allocated to a specific event, work it, and leave. Dining room labor spreads across shifts, includes tip-eligible servers, and varies with covers. Blending the two into a single labor percentage tells the owner nothing useful about either operation.
What the combined report hides
Food cost percentages move for different reasons in each channel. A strong catering month with controlled menus can pull the blended food cost down to 27 percent. The dining room may be running at 33 percent the entire time. An owner looking at the blended number will not see the difference.
Labor cost structures are not comparable. Catering labor is event-bound with a defined start and end. Dining room labor includes split shifts, variable scheduling, and idle coverage between service windows. A blended 38 percent labor cost could mean catering is efficient and the dining room is overstaffed, or the reverse. The combined number provides no way to find out.
Revenue timing creates false volatility. Catering revenue is event-driven and lumpy. One large event cancellation or a slow month with no private bookings moves the top line significantly. In a combined P&L, that looks like the entire restaurant had a bad month. In most cases, only one channel did.
Profitability often runs in opposite directions. When we separated the operations for the restaurant in this example, catering showed a 25 percent net margin. The dining room was at 4 percent. The owner had been reinvesting in both channels without knowing one was funding the other.
What the numbers actually showed
Here is the April P&L before and after separation.
Combined:
| Line | Amount | Percentage |
|---|---|---|
| Revenue | $48,000 | |
| Food cost | $14,400 | 30% |
| Labor | $18,240 | 38% |
| Other operating | $9,600 | 20% |
| Net income | $5,760 | 12% |
Separated:
| Catering | Dining Room | |
|---|---|---|
| Revenue | $18,000 | $30,000 |
| Food cost | $4,500 | $9,900 |
| Food cost % | 25% | 33% |
| Labor | $5,400 | $12,840 |
| Labor % | 30% | 43% |
| Other operating | $3,600 | $6,000 |
| Net margin | $4,500 (25%) | $1,260 (4%) |
The dining room’s 4 percent net margin is not a disaster on its own. But it is fragile. It covers rent and fixed costs and not much else. A few slow weekends without catering revenue to offset them would turn it negative. The owner did not know this until the catering client left.
Why this matters for operating decisions
Pricing decisions are based on the wrong baseline. An owner who believes food cost is running at 30 percent will price new menu items on that assumption. If the dining room’s actual food cost is 33 percent, every pricing decision made from the blended number is off.
Staffing decisions lack a clear target. An owner who sees 38 percent combined labor might assume both channels are running at a similar rate. An owner who sees 43 percent in the dining room and 30 percent in catering knows exactly which operation needs attention.
Channel investment requires channel data. Whether to build out catering capacity, hire a dedicated catering coordinator, or add a weekend brunch service requires knowing which channel is actually generating returns. A single blended P&L cannot answer that question.
What proper channel accounting looks like
For restaurant clients with more than one revenue channel, we set up separate revenue classes in QuickBooks for each. Every sale and every direct cost is tagged to the channel where it occurred.
Shared costs, including rent, kitchen utilities, shared staff, and insurance, are allocated across channels each month using a consistent method. A simple revenue-percentage split works for most restaurants and is straightforward to audit. The result is two P&Ls that roll into one consolidated report, and a combined number that explains itself when you dig into it.
Four practices that keep channel tracking accurate
- Set up revenue classes from the start, not after the fact. Retroactively assigning six months of transactions to channels is a time-consuming project. Starting at transaction entry takes seconds per transaction.
- Allocate direct labor to the channel where the work happened. If two servers work a catering event, those hours go to catering, not to the dining room’s labor account.
- Use a consistent shared-cost allocation method and apply it every month. An allocation formula that changes month to month produces P&Ls that cannot be compared over time.
- Run the separated P&L at least quarterly. Some operators check it monthly. Quarterly is the minimum for catching a trend before it becomes a problem.
Three questions worth asking
- If your catering revenue dropped to zero next month, what would happen to your net margin? Can your current P&L answer that?
- What is your food cost percentage for catering events versus your dining room separately, and when did you last calculate both?
- If you needed to decide whether to expand catering capacity or invest in the dining room, which operation would the numbers support?
If you cannot answer the first two from your current books, the combined report is hiding the answer.
We review monthly P&Ls for restaurant clients and flag when catering and dining room trends start moving in different directions. If you want to know which channel is carrying your operation, send us a recent month and we can map it for you.
- BLENDED REVENUE$48,000 total, no breakdown by channel
- 30% FOOD COSTLooks acceptable for a full-service restaurant
- 38% LABOR COSTNear target, nothing stands out
- 12% NET MARGINPositive result, no obvious problem visible
- CATERING: 25% FOODControlled menus keep per-event cost low
- DINING ROOM: 33% FOODWaste and substitutions push cost up
- CATERING: 30% LABOREvent staff allocated directly per booking
- DINING ROOM: 43% LABORServers, hosts, bussers across all service windows
Want a second set of eyes on your books?
30 minutes on Zoom. We'll look at your books and tell you what's working and what isn't.
This is the work we do every day. See bookkeeping for restaurants.
Book a call