Pour cost: the number that reveals whether your bar is actually profitable
Your bar invoices show 23 percent pour cost. Once comps, over-pours, and breakage are counted, the real number can run 10 points higher and change every major bar decision.
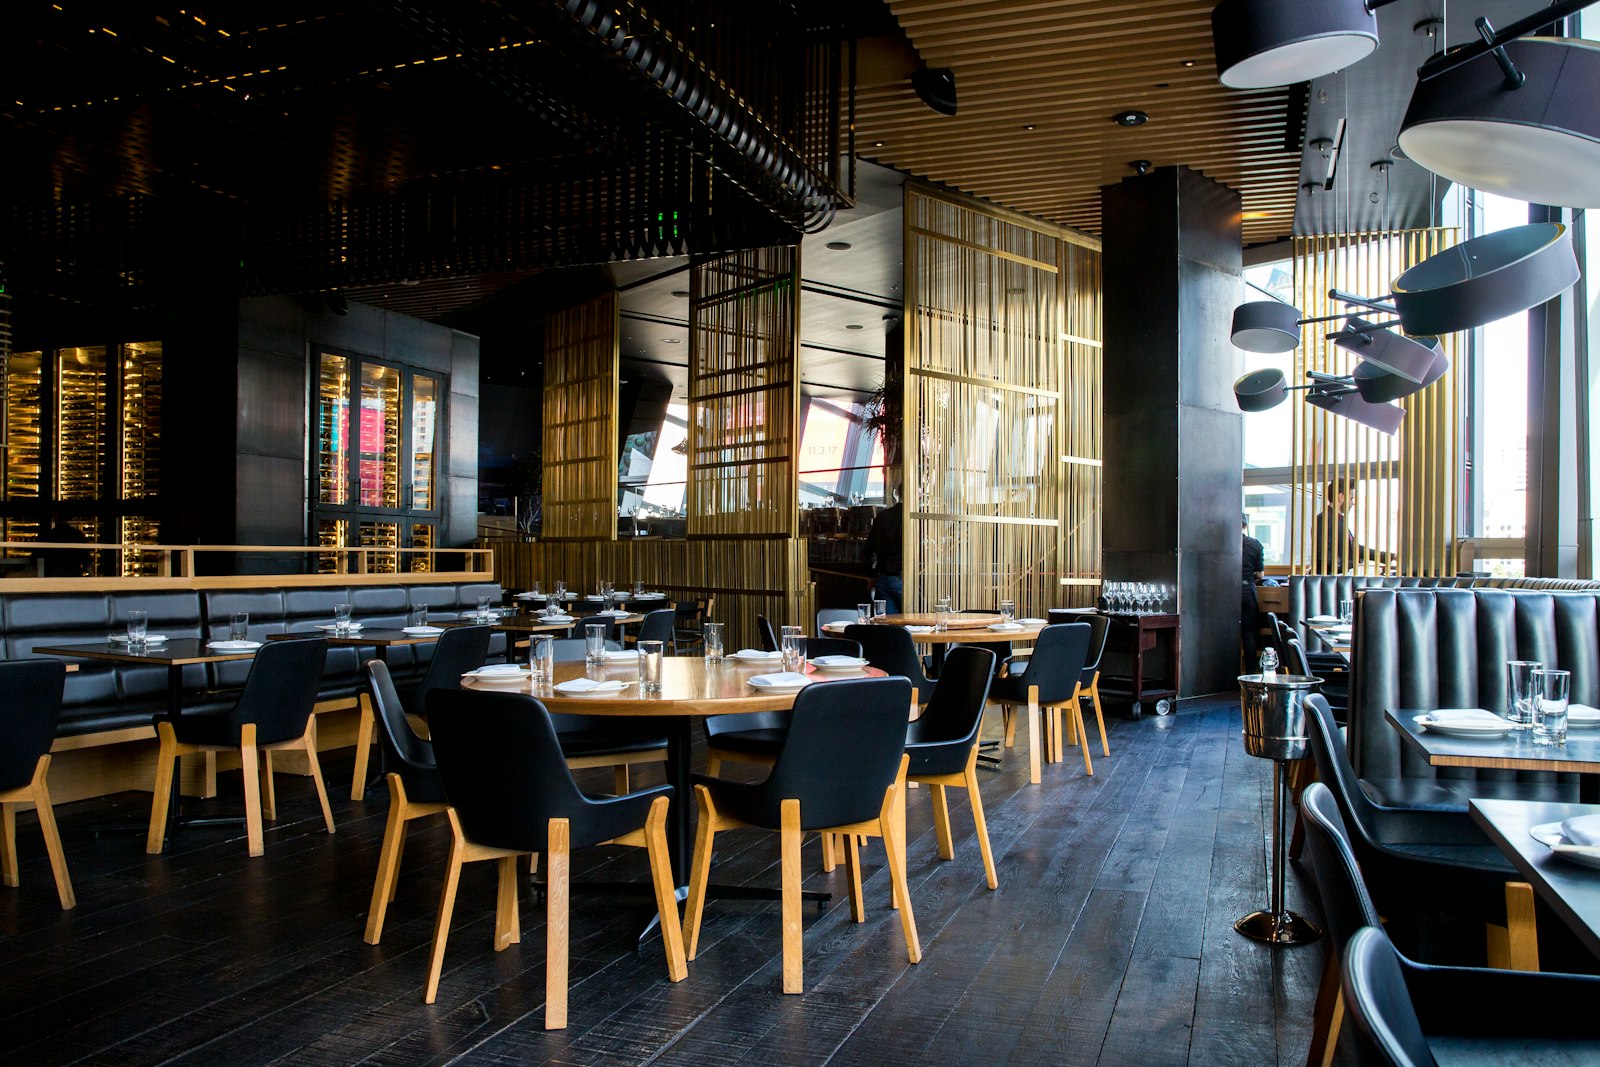
A restaurant we work with had a bar program that appeared to be the most profitable part of the house. Beverage revenue averaged $28,000 a month. Purchase invoices for liquor, beer, and wine totaled $6,500. The owner calculated her pour cost at 23 percent and considered it a business strength. She expanded the cocktail menu, launched a spirits-focused happy hour, and added a second bartender.
Six months later, the bar was busier than ever. The restaurant was tighter on cash than it had been in three years.
What pour cost actually measures
Pour cost is the bar program’s equivalent of food cost: the share of beverage revenue consumed by the cost of everything poured. A healthy pour cost for a full-service bar runs between 28 and 32 percent. Below 20 percent, either the pricing is unusually high or the calculation is missing something. Above 35 percent, the bar is consuming more in product than the margin can support.
Most operators calculate pour cost using purchase invoices alone. That number is accurate as far as it goes. It reflects what was ordered and paid for. It does not reflect what was given away, poured heavy, spilled, expired, or broken. The difference between those two figures is where bar margin disappears, month after month.
Four costs that never appear on an invoice
Comps and staff beverages. Every bar program includes this: a shift drink for the closing bartender, a round sent to a dissatisfied table, a cocktail comped for a regular. These represent real inventory consumed and real cost incurred. At a bar doing $28,000 in monthly revenue, comps typically run $800 to $1,500. Unless they are logged and recorded against beverage cost, they are invisible to the books.
Over-pours. A standard spirit pour is 1.5 ounces. A bartender working quickly often pours 1.7 or 1.8 ounces. Across 2,000 drink covers a month, an extra 0.2 to 0.3 ounces per pour adds up to several hundred additional ounces of spirits used but not sold. At an average spirit cost of $1.80 per ounce, that variance can reach $700 a month before any other adjustment.
Breakage and spillage. A bottle dropped during a busy Friday shift. A keg that kicked mid-pour and the partial pint was discarded. An open bottle of white wine left out on a slow Monday and poured down the drain at closing. These losses are real inventory costs. They belong in pour cost. They are almost never recorded there.
Slow-moving and expired inventory. A specialty liqueur ordered for a seasonal cocktail menu that did not move. A case of sparkling wine left over after a private event with no plan for the remaining bottles. Inventory that sits and expires is not an abstract loss. It is beverage cost that never produced revenue, and it needs to be written off and counted.
What the numbers looked like in the books
Here is what one month of bar cost looked like for this client once every category was tracked.
| Cost category | Monthly amount |
|---|---|
| Purchase invoices (liquor, beer, wine) | $6,500 |
| Comps and staff beverages | $1,200 |
| Over-pours and spillage | $800 |
| Expired and broken inventory | $900 |
| Total actual pour cost | $9,400 |
| Bar revenue | $28,000 |
| Actual pour cost percentage | 33.6% |
The 23 percent figure was accurate. It measured purchase invoices. The actual pour cost was 33.6 percent. That sits at the high end of the acceptable range and is correctable, but it is a different number, and every decision made from it is a different decision.
Why the gap matters
Three categories of decisions rest on pour cost, and all three go wrong when the number is incomplete.
Pricing. At 23 percent apparent pour cost, a $14 cocktail appears to clear roughly $10.78 in gross margin before labor. At a true 34 percent pour cost, the same cocktail clears $9.24. That reduction compounds across total drink volume. A bar doing 400 cocktail covers a week sees the difference in the bank account, not only on the report.
Staffing. A bar that appears to run at 77 percent gross margin can support more labor than one running at 66 percent. Adding a second bartender based on the wrong pour cost builds payroll into a margin that does not exist.
Reorder and menu decisions. When purchase invoices are the only measure, inventory decisions look simple: if it sells, reorder it. Pour cost that includes slow-moving write-offs reframes that question. Some SKUs that appear profitable are absorbing margin through spoilage. Some specialty spirits earn their place on the back bar. Others are a cost center with no corresponding revenue.
What accurate pour cost tracking looks like
For restaurant clients with active bar programs, we track four categories separately in QuickBooks: purchase invoices, comps and staff beverages, breakage and spillage, and slow-moving write-offs.
Purchase invoices post to a Beverage Cost account as they arrive. Comps are logged at the point of sale with a reason code and reconciled to Beverage Cost at the end of each month. Breakage and spillage are recorded on a bar waste log and entered as inventory adjustments at the end of each week. Slow-moving SKUs are reviewed every 30 days, and items that have not moved are either priced to clear or written off before the next order goes in.
The resulting pour cost number is higher than the purchase-invoice number. It should be. It is also accurate, which means the business decisions made from it are accurate.
Four practices that keep pour cost on track
- Log comps at the point of sale with a reason code rather than voiding them. A voided check leaves no record. A comp with a reason code creates an entry that ties back to actual inventory consumed and flows into the monthly pour cost calculation.
- Run a physical bar inventory count at the end of each week. The variance between beginning inventory plus purchases and ending inventory should match pour volume. A consistent overage larger than 3 percent is a signal worth investigating promptly.
- Keep a bar waste log behind the bar. A notebook or shared note where bartenders record breakage and spills takes two minutes per shift and removes the guesswork when reconciling pour cost at month end.
- Review slow-moving inventory before each order. Anything that has not sold in 30 days should be cleared or written off before more of it is purchased. Reordering slow inventory adds to pour cost without adding to revenue.
Three questions worth asking
If you are not certain how pour cost is being calculated today, three questions to ask whoever manages your books:
- Does the pour cost number include comps and staff beverages, or does it reflect purchase invoices only?
- Where do bar waste, breakage, and spoilage appear on the Profit and Loss report (P&L)? Are those entries tied to beverage cost or buried somewhere else?
- When was the last physical bar inventory count reconciled against the beverage cost of goods sold in the books?
If those answers are uncertain, the pour cost number is incomplete. Correcting it is a workflow question, not a software question. Most bar programs can have accurate pour cost tracking in place within a few weeks.
If you want a clearer picture of your bar program’s actual performance, send us a recent month of beverage purchase invoices along with your point-of-sale comp report. We will review what is being tracked, identify what is missing, and tell you what your corrected pour cost looks like.
- PURCHASE INVOICES$6,500 in liquor, beer, and wine this month
- APPARENT POUR COST23% of $28,000 in monthly bar revenue
- APPARENT MARGIN77% gross margin before labor and overhead
- APPARENT DECISIONBar is the most profitable part of the restaurant
- COMPS AND STAFF DRINKS$1,200 of inventory used but not sold
- OVER-POURS AND SPILLAGE$800 of variance between recipe pour and actual
- EXPIRED AND BROKEN INVENTORY$900 of slow-moving and broken bottles
- ACTUAL POUR COST$9,400 total, or 34% of $28,000 in bar revenue
Want a second set of eyes on your books?
30 minutes on Zoom. We'll look at your books and tell you what's working and what isn't.
This is the work we do every day. See bookkeeping for restaurants.
Book a call